Understanding Candlestick Patterns for Successful Trading
Candlestick Patterns Explained
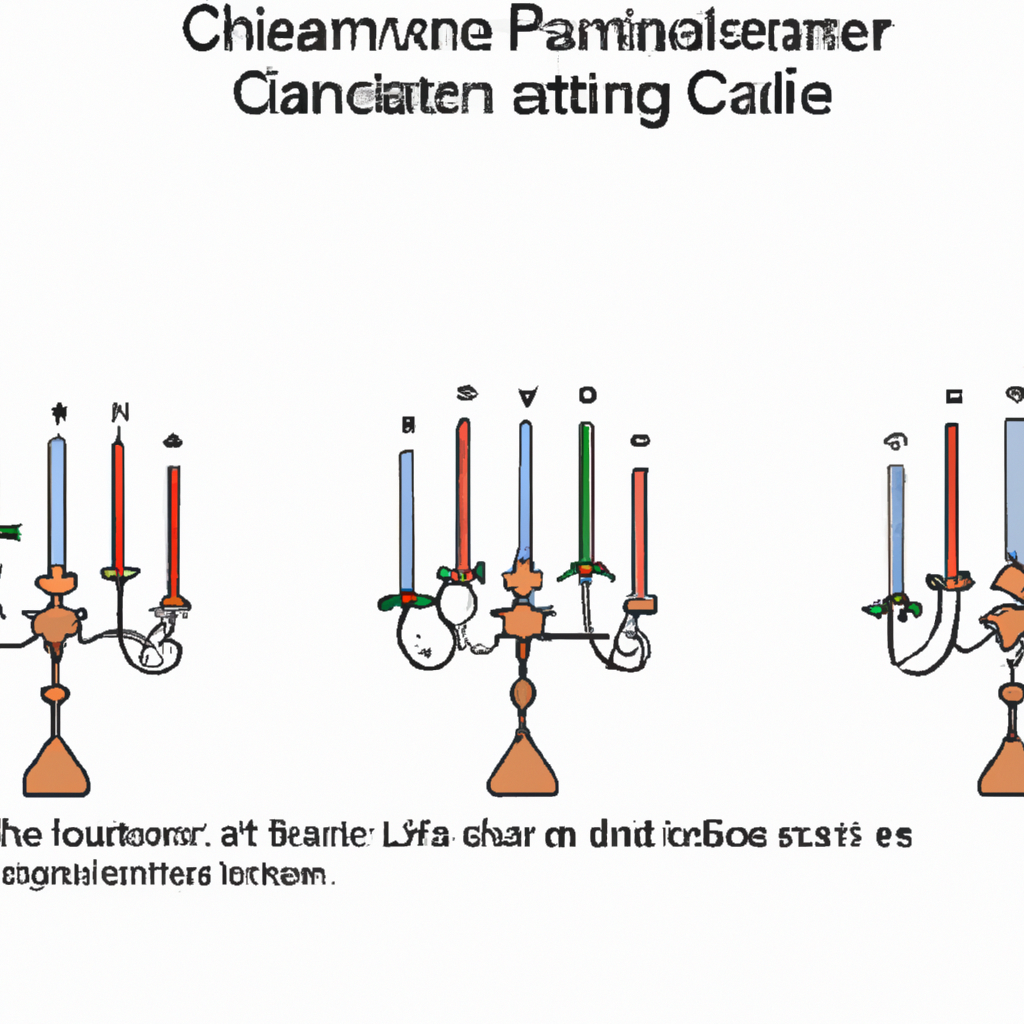
Candlestick patterns are a popular tool used by traders to analyze price movements in the financial markets. These patterns can provide valuable insights into market sentiment and help traders make informed decisions about when to buy or sell assets. In this article, we will explain the most common candlestick patterns and how to interpret them.
1. Doji
A doji is a candlestick pattern that indicates indecision in the market. It is characterized by a small body with wicks on both ends, signifying that the opening and closing prices were very close to each other. A doji can suggest a potential reversal in the trend, especially when it occurs after a strong uptrend or downtrend.
2. Hammer
A hammer is a bullish reversal pattern that consists of a small body with a long lower wick. This pattern indicates that buyers have stepped in to push the price higher after a period of selling pressure. Traders often look for hammers near support levels as a signal to go long.
3. Shooting Star
A shooting star is a bearish reversal pattern that looks similar to a hammer but occurs at the top of an uptrend. It has a small body with a long upper wick, indicating that sellers have overwhelmed buyers and pushed the price lower. Traders may interpret a shooting star as a signal to sell or go short.
4. Engulfing Pattern
An engulfing pattern consists of two candles, where the second candle completely engulfs the body of the first candle. A bullish engulfing pattern occurs after a downtrend and signals a potential reversal to the upside, while a bearish engulfing pattern occurs after an uptrend and signals a potential reversal to the downside.
5. Morning Star
The morning star is a bullish reversal pattern that consists of three candles. The first candle is a long bearish candle, followed by a small candle with a gap down, and finally, a long bullish candle that closes above the first candle’s open. The morning star pattern suggests a reversal from a downtrend to an uptrend.
Conclusion
Candlestick patterns are a powerful tool for traders to analyze market sentiment and make informed trading decisions. By understanding the various patterns and their interpretations, traders can gain an edge in the financial markets and improve their trading performance. Remember to always use candlestick patterns in conjunction with other technical analysis tools to confirm your trading decisions.