A Beginner’s Guide to Identifying Chart Patterns
Introduction to Chart Patterns
Chart patterns play a crucial role in technical analysis by providing insights into market psychology and potential price movements. Traders and investors analyze these patterns in the price charts of securities to make informed predictions about future market behavior. Identifying common chart patterns is a fundamental skill in trading, as it helps in timing the market more effectively and in making more educated investment decisions.
Types of Chart Patterns
Chart patterns can broadly be categorized into continuation and reversal patterns. Continuation patterns signal that an ongoing trend is likely to continue after a brief pause, while reversal patterns indicate a potential change in the direction of the prevailing trend.
Continuation Patterns
Some of the most common continuation patterns include:
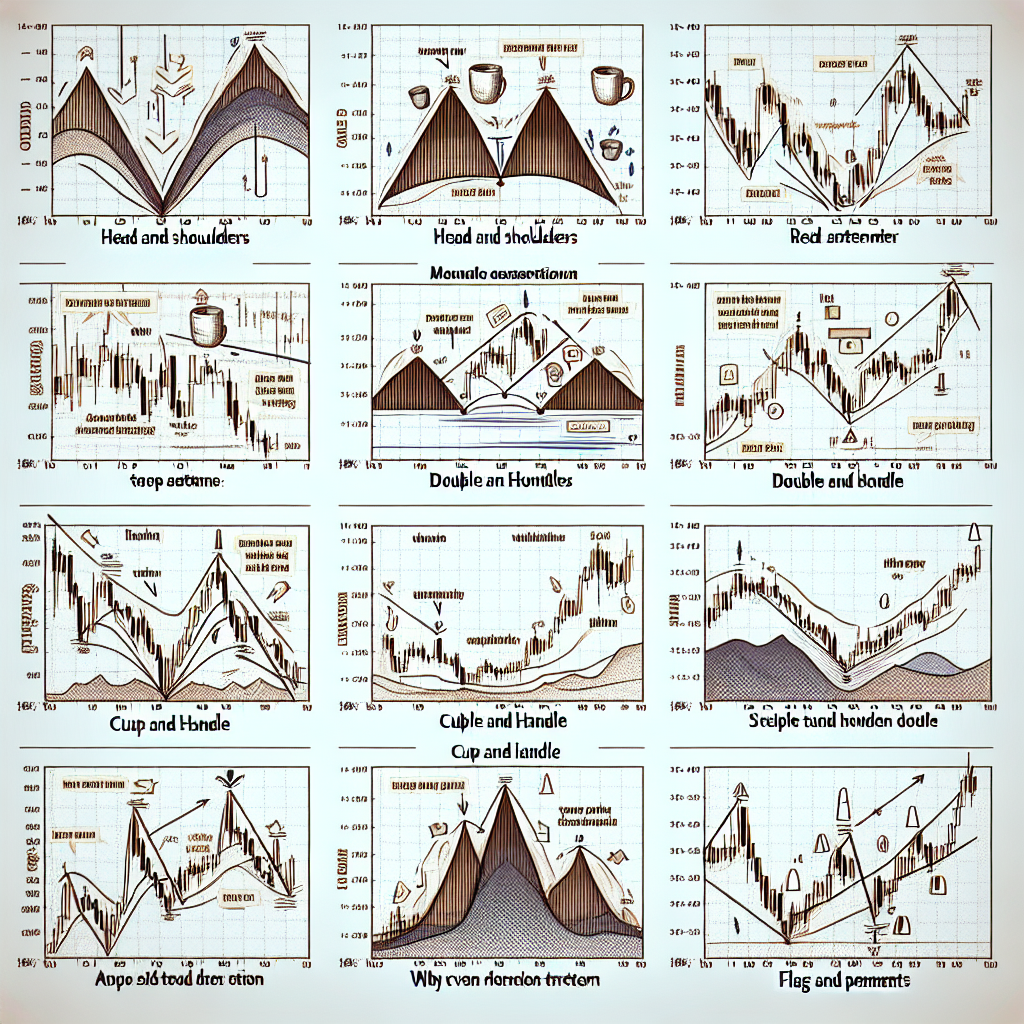
- Flags: Characterized by a small rectangular shape that slopes against the prevailing trend, appearing like a flag on a pole.
- Pennants: Similar to flags, but the shape is a small symmetrical triangle that starts wide and converges as the pattern develops.
- Triangles: Formed by converging trend lines and can be ascending, descending, or symmetrical. They represent a consolidation period before the trend resumes.
Reversal Patterns
These patterns signify that the current trend might be about to change direction. Some well-known reversal patterns include:
- Head and Shoulders: This pattern has three peaks, with the middle one (the head) being the highest and the two others (shoulders) being lower but approximately at the same height.
- Inverse Head and Shoulders: The inverse version of the head and shoulders, typically indicating a bullish reversal.
- Double Top and Double Bottom: These patterns resemble the letter “M” (for a double top) or “W” (for a double bottom) and signal a trend reversal.
Identifying Chart Patterns
Accurately identifying chart patterns involves recognizing the formation’s shape and understanding the market conditions that give rise to these patterns. Here are a few steps to help in identifying these patterns effectively:
Step 1: Understand the Market Context
Begin by assessing the broader market context and the prevailing trend. This includes considering not just the pattern itself, but also indicators such as volume and moving averages that can provide additional clues about potential market moves.
Step 2: Look for Key Patterns
Focus on spotting the shapes and formations described earlier. It’s crucial to wait for the pattern to fully form, as entering a trade too early can lead to false signals.
Step 3: Confirm with Volume
Volume should typically increase on the breakout side of the pattern for confirmation. For example, in a bullish breakout, look for an increase in volume as the price exits the pattern. This serves as confirmation that the pattern is valid and the move is supported by market participants.
Step 4: Calculate Price Targets
Most chart patterns provide a means to calculate an expected move. This involves measuring the height of the pattern and projecting that distance from the breakout point. This can help in setting profit targets and stop-loss levels.
Conclusion
Identifying common chart patterns is an essential skill for any trader or investor engaged in technical analysis. While mastering these patterns can take time, understanding their basics and practicing regularly can significantly enhance one’s ability to forecast future market movements. Remember, no pattern works all the time, so always use chart patterns in conjunction with other analysis methods to confirm your trading decisions.