Technical analysis

Maximizing Profits: MACD Crossover Trading Techniques
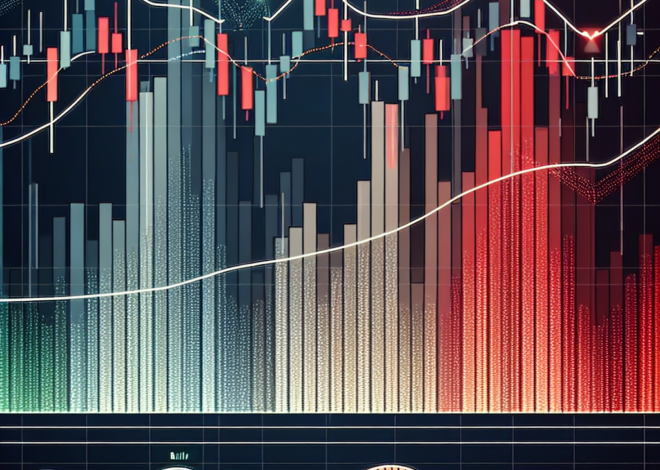
Introduction to MACD Crossovers Trading with Moving Average Convergence Divergence (MACD) crossovers is a popular strategy among traders. The MACD is a trend-following momentum indicator that shows the relationship between two moving averages of a security’s price. A MACD crossover occurs when the MACD line crosses above or below the signal line, indicating potential buying […]
Mastering Elliott Wave Analysis for Trading Success
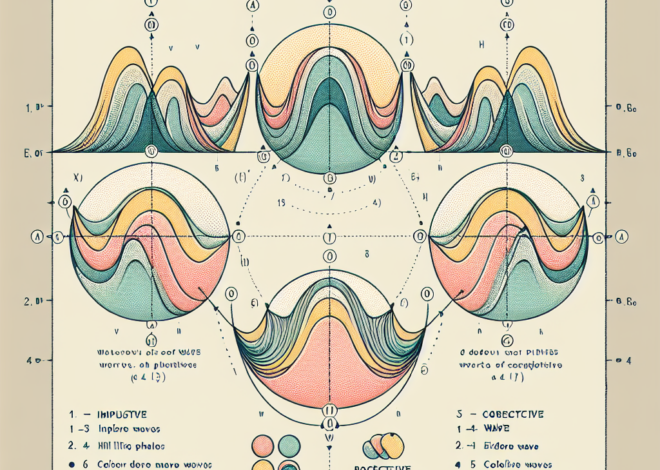
Introduction to Elliott Wave Analysis Methods Elliott Wave Analysis is a technical analysis technique that traders use to forecast market trends by identifying extremes in investor psychology, highs and lows in prices, and other collective factors. Developed by Ralph Nelson Elliott in the 1930s, it’s based on the theory that market movements are patterned and […]

Mastering Elliott Wave Analysis in Trading
An Introduction to Elliott Wave Analysis Elliott Wave Theory is a method of technical analysis that believes markets move in repetitive cycles, which reflect the emotions of investors caused by external influences or mass psychology. Originally developed by Ralph Nelson Elliott in the 1930s, this theory attempts to identify recurring patterns within financial markets and […]
Mastering MACD Histogram for Trading Success
Understanding the MACD Histogram: Interpretations and Trading Signals Introduction to MACD Histogram The Moving Average Convergence Divergence (MACD) histogram is a powerful technical analysis tool used by traders to identify potential trend reversals, momentum, and entry or exit points in the market. Developed by Gerald Appel in the late 1970s, the MACD histogram not only […]
Mastering Support and Resistance Zones in Trading
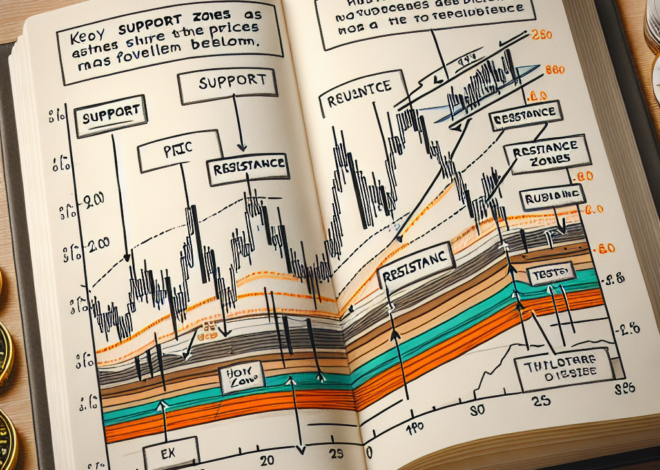
Understanding Support and Resistance Zones Support and resistance zones are foundational concepts in the analysis of financial markets. These zones help traders and investors understand potential turning points in price movements. A support zone is a price level at which a downtrend can be expected to pause due to a concentration of demand. Conversely, a […]
A Beginner’s Guide to Identifying Chart Patterns
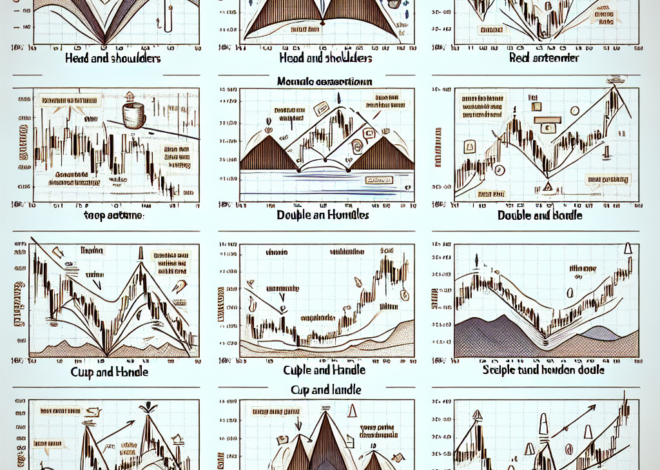
Introduction to Chart Patterns Chart patterns play a crucial role in technical analysis by providing insights into market psychology and potential price movements. Traders and investors analyze these patterns in the price charts of securities to make informed predictions about future market behavior. Identifying common chart patterns is a fundamental skill in trading, as it […]
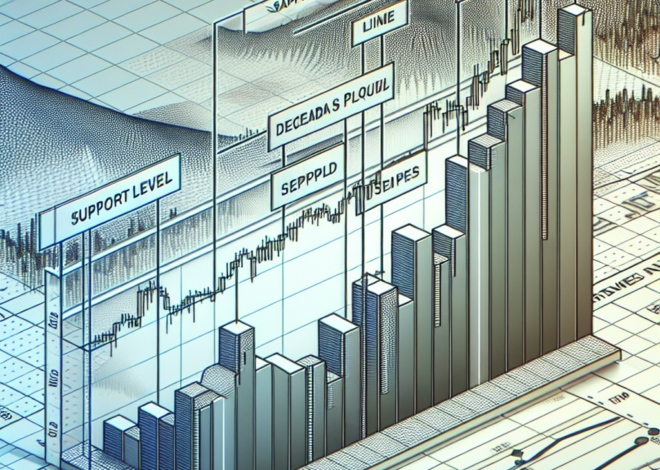
Mastering the Art of Identifying Support Levels
Finding Reliable Support Levels: A Guide for Investors and Traders Finding reliable support levels is a key skill for anyone involved in the stock market. Whether you’re a seasoned investor, a day trader, or somewhere in between, understanding where these levels lie can help inform your buy or sell decisions, potentially leading to more profitable […]
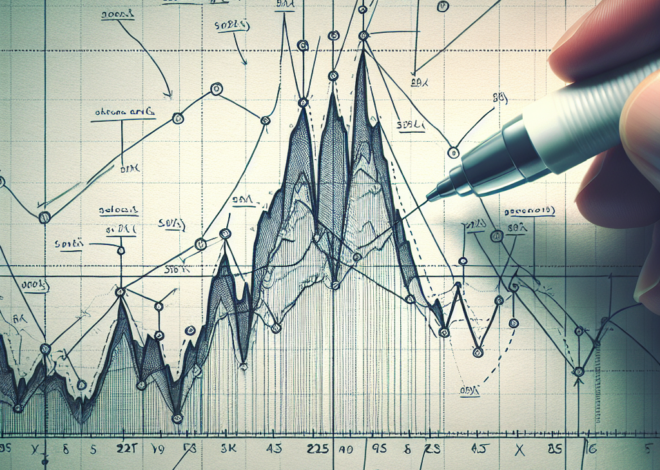
Mastering Accurate Trend Line Drawing Techniques
# Drawing Accurate Trend Lines: A Comprehensive Guide Drawing accurate trend lines is a critical skill for anyone involved in technical analysis, trading, or financial market analysis. Trend lines help identify and confirm trends, support and resistance levels, and can indicate potential reversal points. This guide will walk you through the steps to draw accurate […]

Sentiment Analysis: A New Dimension in Trading
# Sentiment Analysis in Technical Trading In the rapidly evolving landscape of financial trading, sentiment analysis has emerged as a pivotal tool for traders leveraging technical analysis. This methodology delves into the mood or opinions of the market participants, aiming to predict future market movements based on the collective sentiment. This article will guide you […]

Mastering Price Action Trading: Techniques and Tips
Price Action Trading Techniques Understanding Price Action Trading Techniques Price action trading is a strategy that allows traders to read the market and make subjective trading decisions based on the recent and actual price movements, rather than relying solely on technical indicators. It focuses on the price movement of securities and is often used by […]