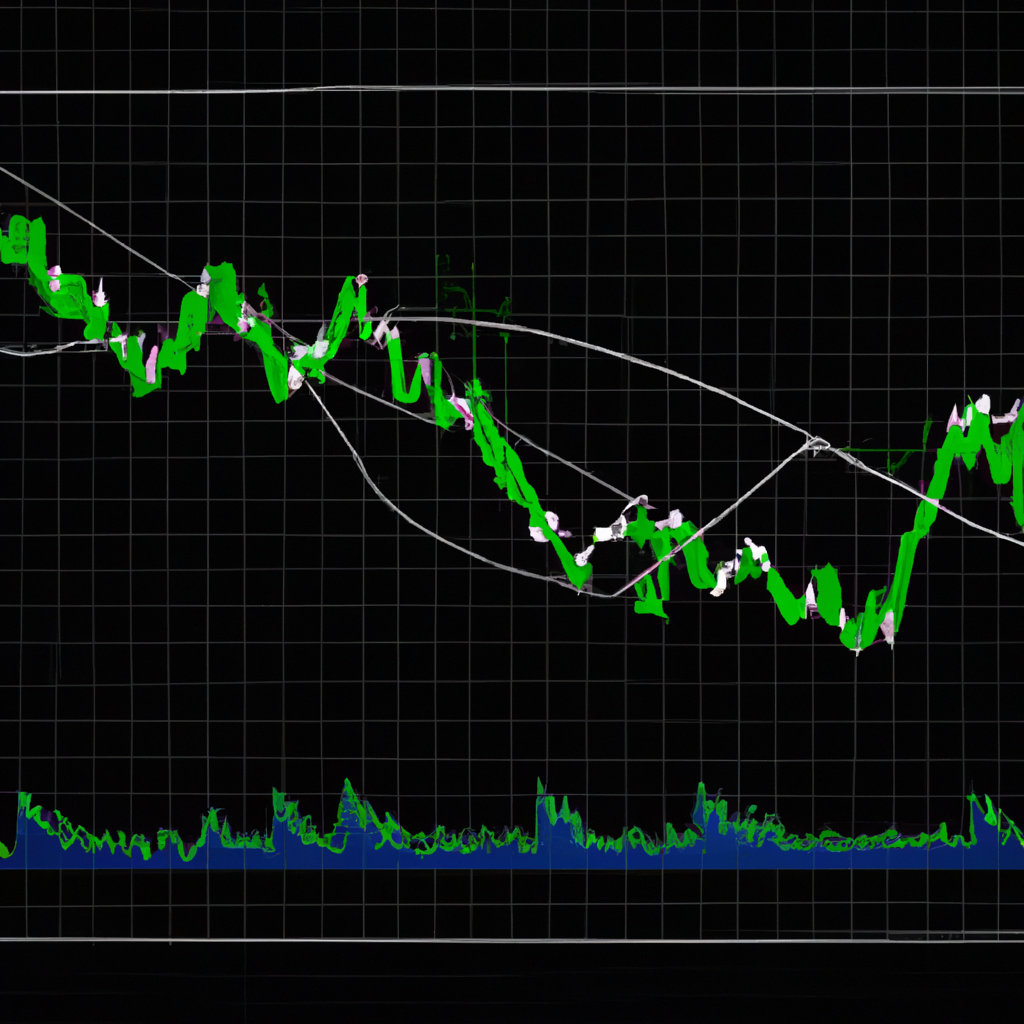
Trading Strategies with MACD Crossovers: A Guide for Traders
Trading with MACD Crossovers
The Moving Average Convergence Divergence (MACD) is a popular technical indicator used by traders to identify potential buy and sell signals in the market. One of the most common ways to use the MACD is through crossovers, which occur when the MACD line crosses above or below the signal line. In this article, we will discuss how to trade using MACD crossovers.
Understanding the MACD Indicator
Before we delve into trading strategies using MACD crossovers, it is important to understand how the indicator works. The MACD is calculated by subtracting the 26-period Exponential Moving Average (EMA) from the 12-period EMA. The signal line is a 9-period EMA of the MACD line. When the MACD line crosses above the signal line, it is considered a bullish signal, while a crossover below the signal line is seen as bearish.
Trading Strategies with MACD Crossovers
There are several ways to trade using MACD crossovers, but two common strategies are the MACD crossover and the MACD histogram strategy.
MACD Crossover Strategy
The MACD crossover strategy involves buying when the MACD line crosses above the signal line and selling when it crosses below. This strategy is based on the idea that crossovers indicate a change in momentum and can help traders identify potential trend reversals.
For example, if the MACD line crosses above the signal line while both are below the zero line, it could be a signal to buy. Conversely, if the MACD line crosses below the signal line while both are above the zero line, it could be a signal to sell.
MACD Histogram Strategy
The MACD histogram strategy involves using the histogram, which is the vertical bars that represent the difference between the MACD line and the signal line. Traders look for divergences between the histogram and price to identify potential trading opportunities.
For example, if the price is making higher highs while the histogram is making lower highs, it could be a signal that the trend is losing momentum and a reversal could be imminent. Traders can use this information to enter or exit trades based on the direction of the histogram.
Risks and Considerations
While MACD crossovers can be a useful tool for traders, it is important to remember that no indicator is foolproof. It is essential to use other technical analysis tools and risk management strategies to confirm signals and protect against potential losses.
Additionally, it is important to consider the timeframe in which you are trading. MACD crossovers may work better in certain timeframes than others, so it is important to test different strategies and adjust accordingly.
In conclusion, trading with MACD crossovers can be a valuable tool for traders looking to identify potential buy and sell signals in the market. By understanding how the MACD works and implementing sound trading strategies, traders can improve their chances of success in the market.